Month: July 2013

Charting Apps – An Informal Review (2)

Note: this is Part 2 – please refer to the previous post for an introduction to these reviews.

Since starting to draft these posts I have come across a comprehensive review that pretty much covers all of the charting software available for the iPad, here’s the link. It’s a nice review, broad and not too deep with examples that will perhaps provide you with a better sense of how the apps will meet your needs. I’ll still carry on with what may be a more detailed look at the various apps.

1. iNavX (iNavX)
2. Navionics Marine & Lakes (Navionics)
3. Transas iSailor (iSailor)

I have purchased all three and have use the first two extensively both for planning a trip and while on the water. I haven’t used iSailor while boating for a reason that I will explain when we get to it. I will review each of the apps in the order listed above, with additional details, some comments, screen shots and videos as appropriate. Before we start there are a couple of details worth mentioning.

1. I am solely interested in how these charting apps work in an around the Georgian Bay 30,000 Islands. How they might perform elsewhere was not considered. And we typically travel at about 25 mph/knots when not dinking around the outer islands trying to avoid the uncharted rocks.

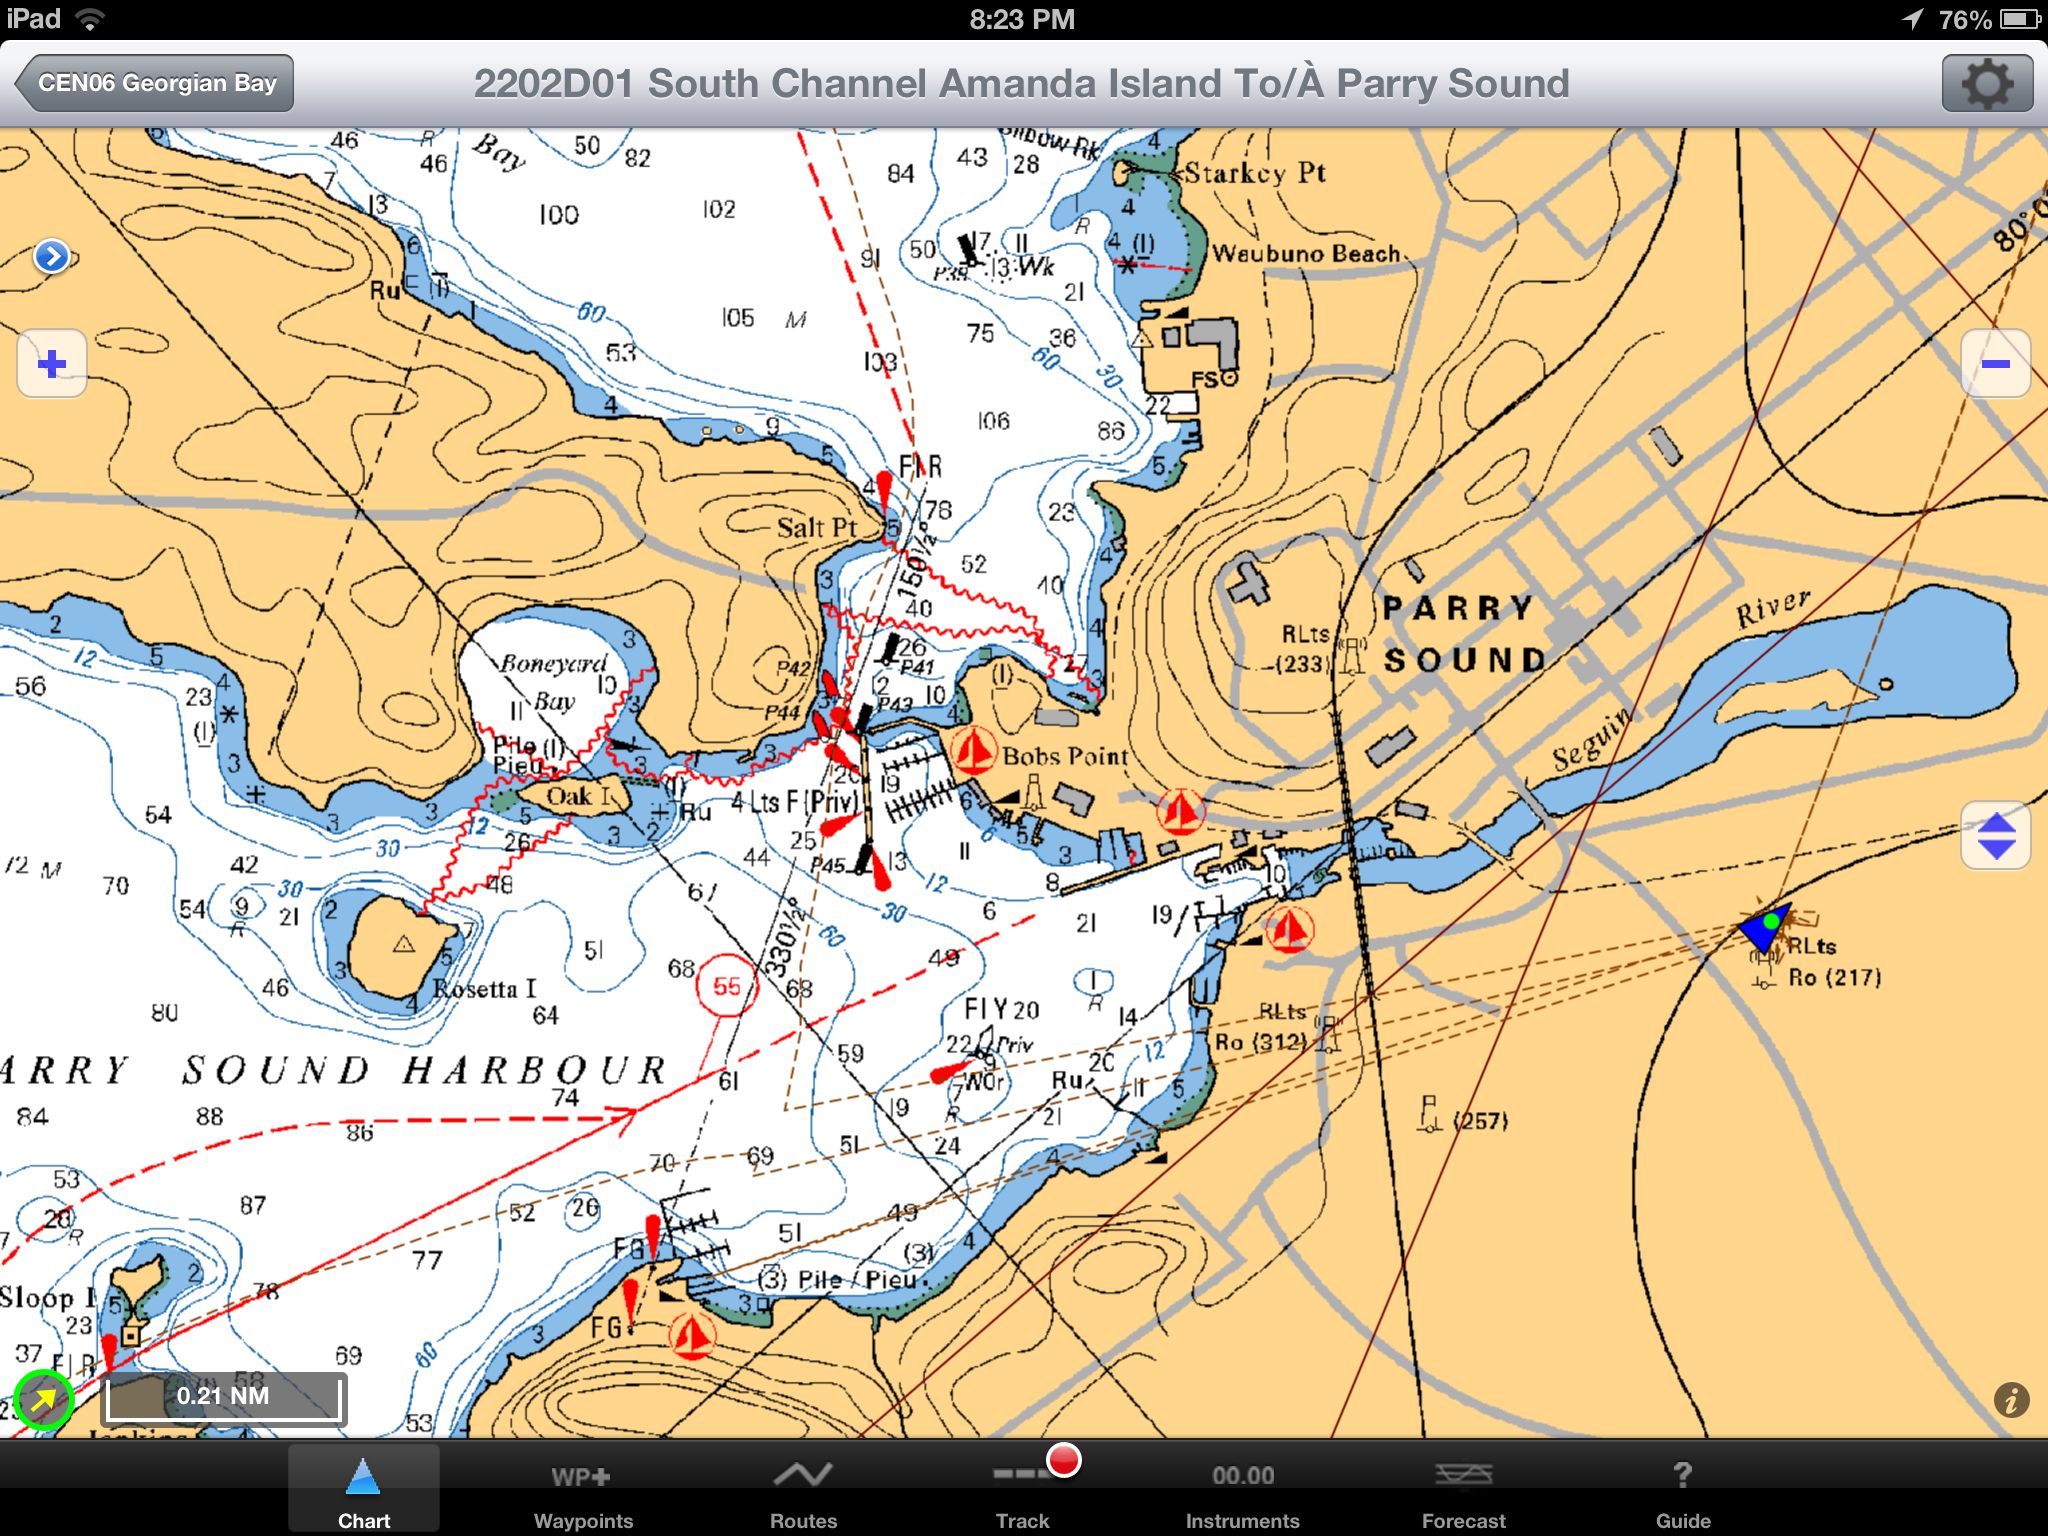
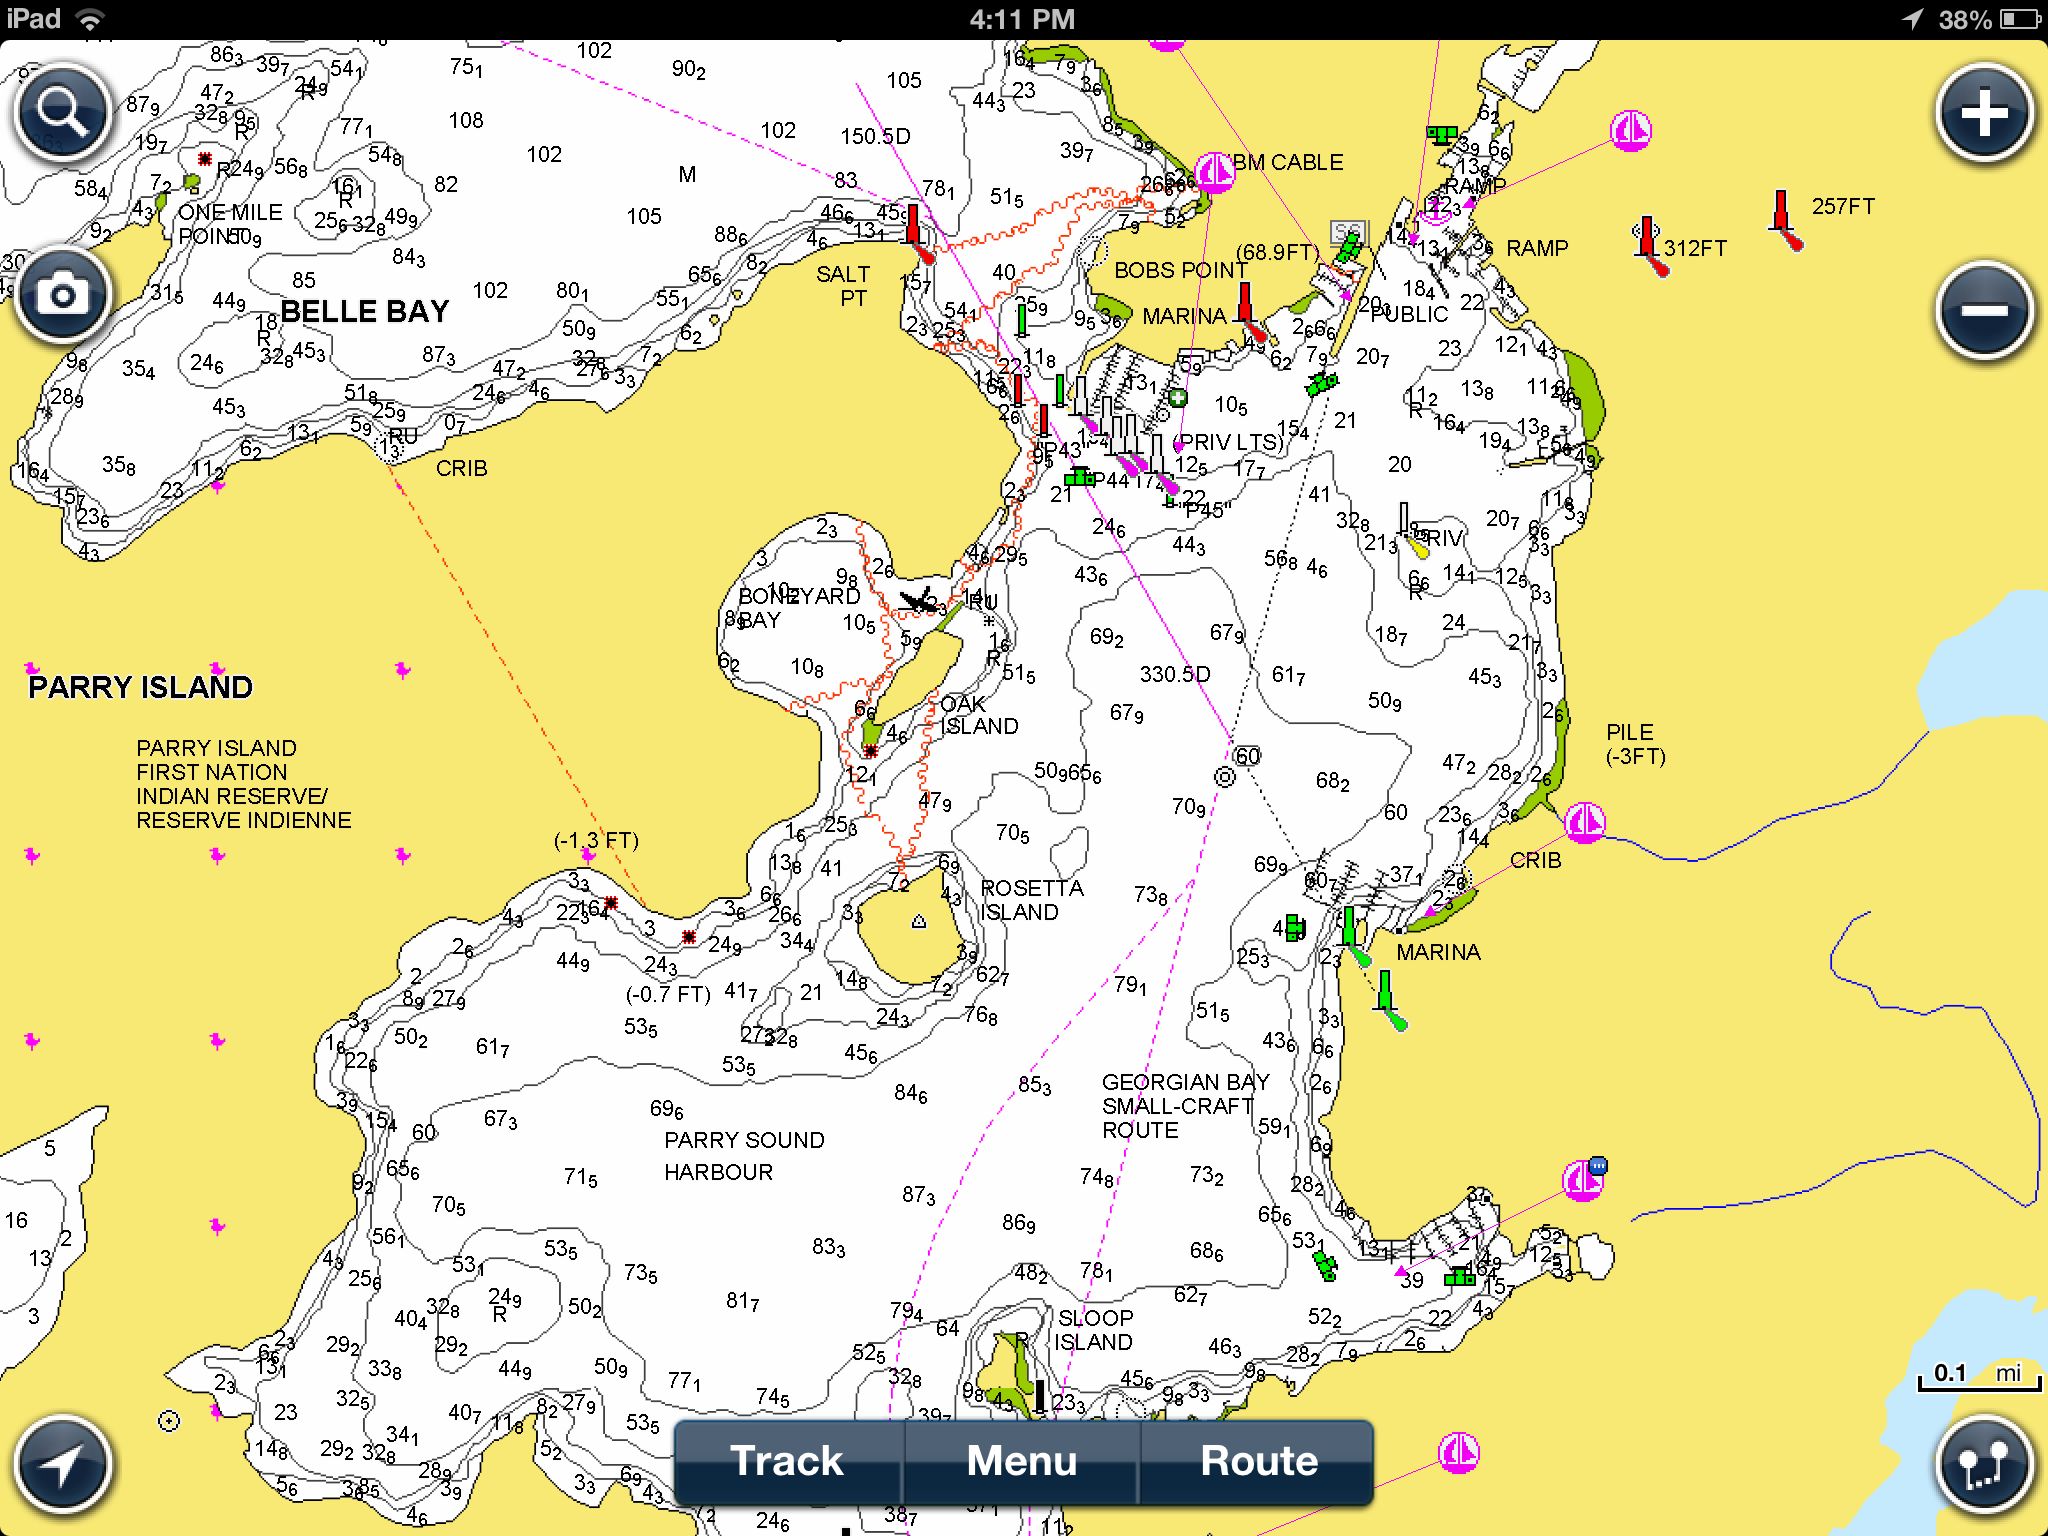
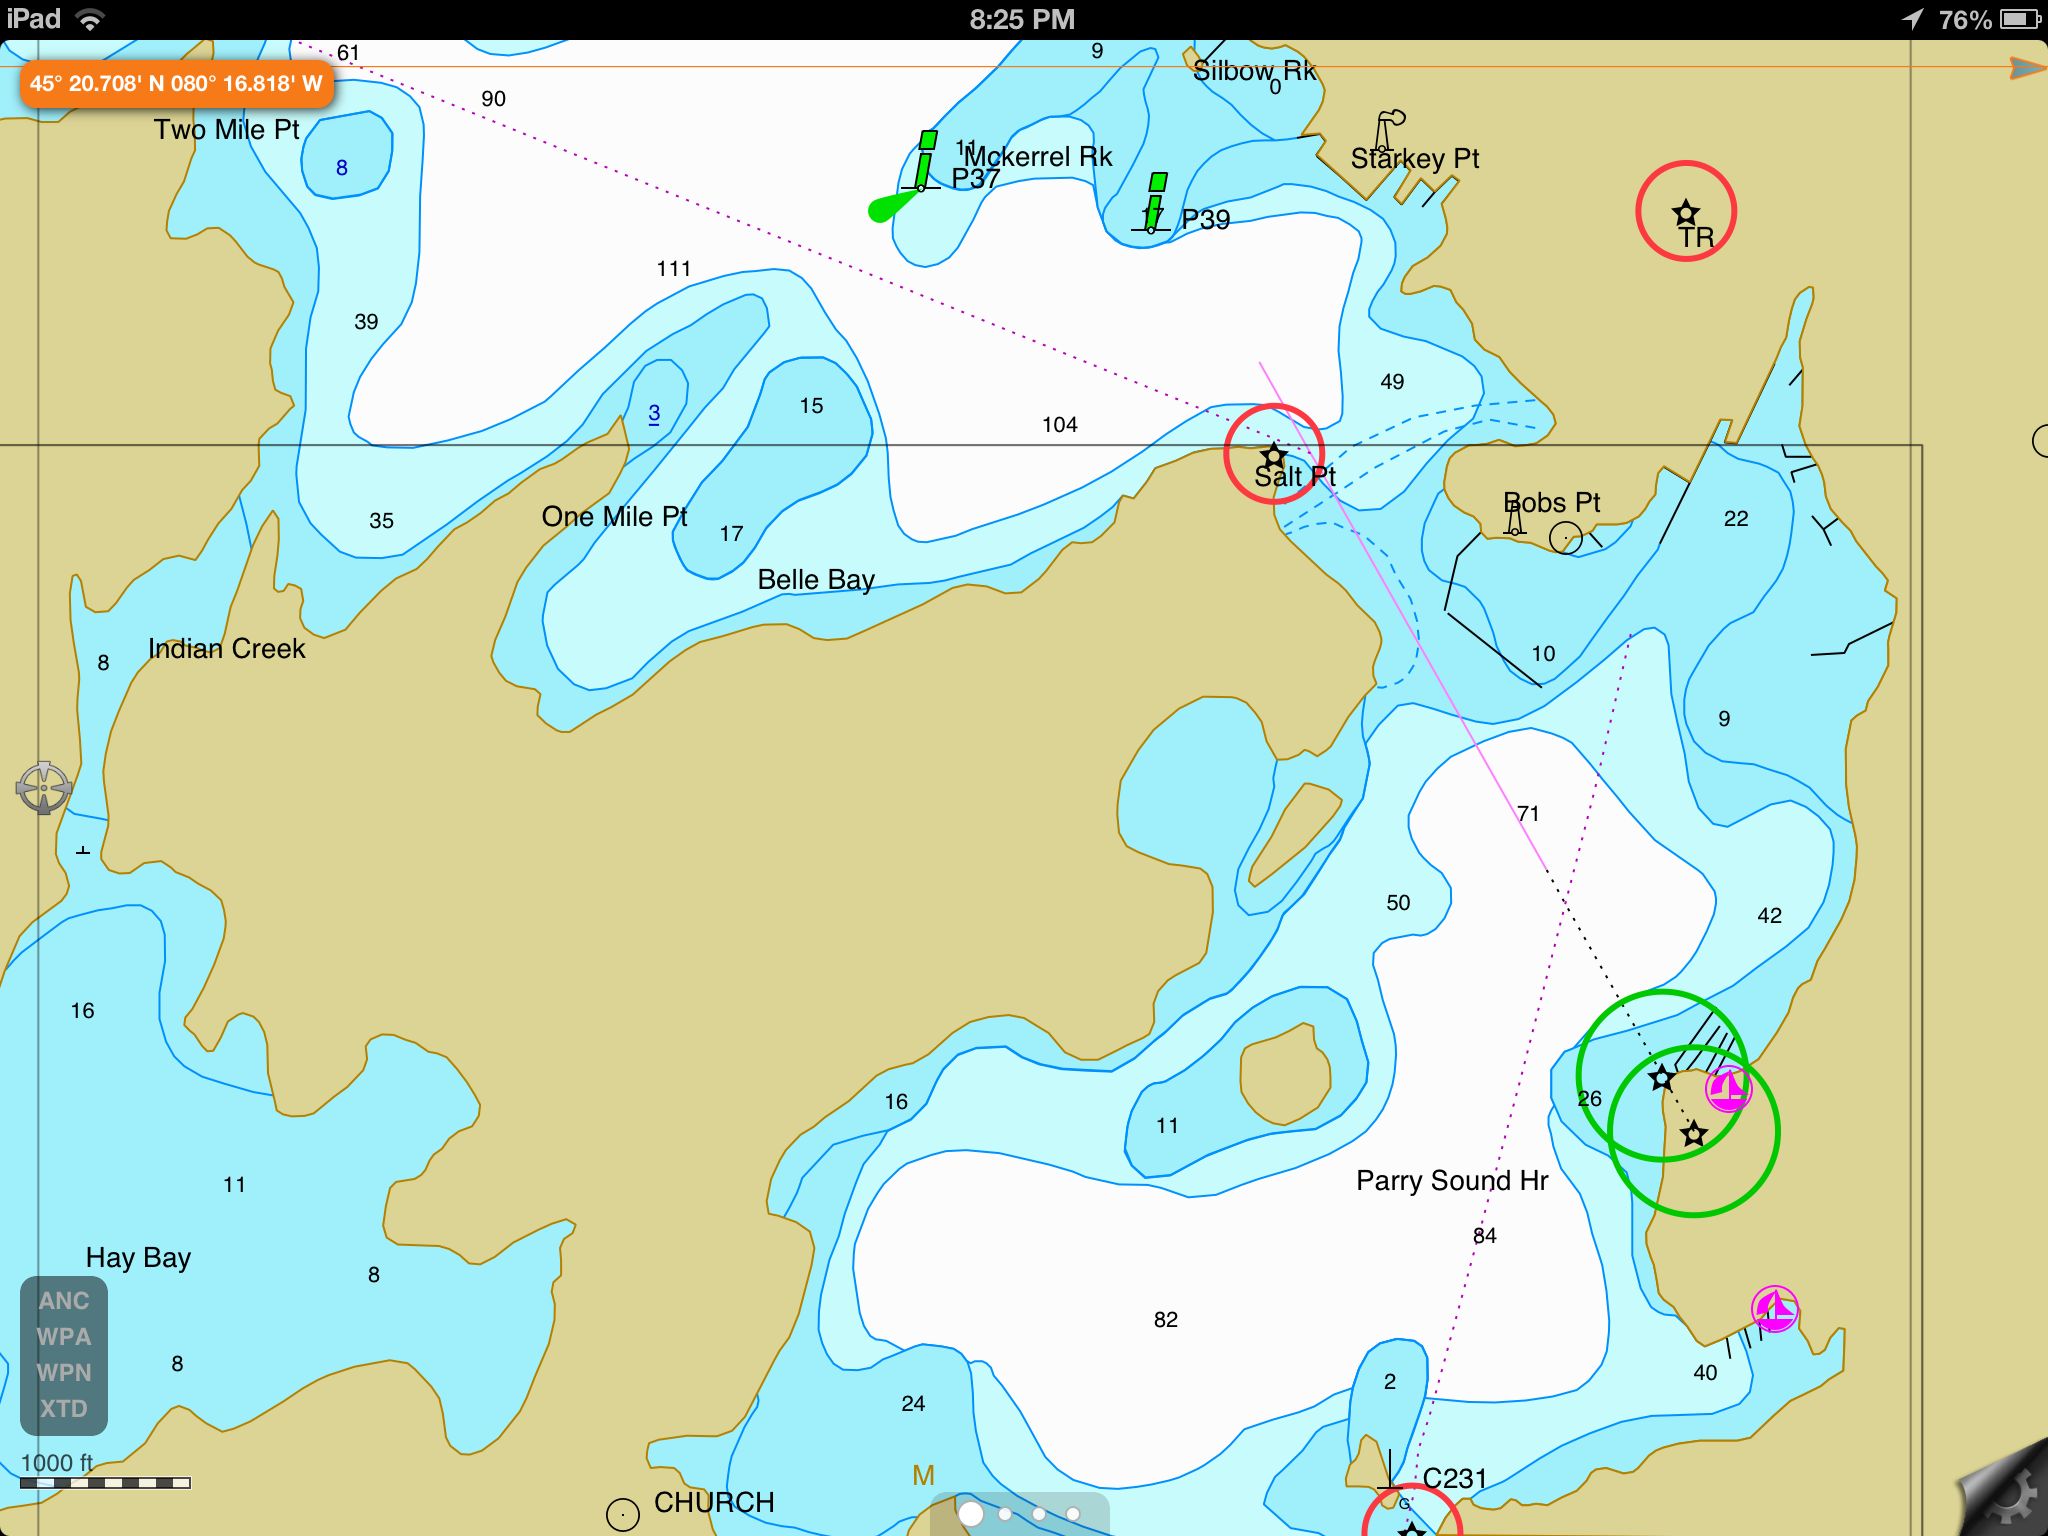
2. The charting apps come in two flavours: raster and vector graphic based. iNavX uses raster graphics, while iSailor and Navionics use vector graphics. Rather than provide a detailed description of the two types of graphics, I’ll use three images that should help you understand the difference, as well as a short video of how they look on the iPad.

All three of the images below are of Parry Sound Harbour, and show the app’s default view. They can be expanded as we’ll see later but these screen-shots basically show you what you would see if you turned on the three apps and took a look at this location. One more note: I don’t read manuals until I get to the point of not being able to figure out how to get what I want, and I figure I really do need help. This approach reflects reality for most boaters, these are apps, you turn them on and use them. If they require too much reading and remembering to use the basic functions they probably aren’t what you want. (I’m not an IT person but I’ve had a computer since about 1980, and I’m currently working with a software company to make their interface (nothing to do with charts or apps)  more user friendly, so I wouldn’t consider myself inexperienced. If I can’t figure it out ‘by pushing the buttons’ it probably isn’t that simple to use.

Her’s the iNavX view of Parry Sound Harbour (raster graphics).

IMG_0501

Here’s the Navionics view of Parry Sound Harbour (vector graphics).

IMG_0503

And finally the iSailor view of Parry Sound Harbour (vector graphics).

IMG_0502

In the video below I provide a brief look a the apps and how they perform. I’ll go into more detail as I discuss the apps individually.

The next installment, Part 3, takes a look at the iNavX app in more detail.

Charting Apps – An Informal Review (1)

As a small company (www.redrockeco.com) providing adventures in the Georgian Bay Biosphere we are regularly out on the water either with clients or working out new adventures. Operating with a 21′ foot Scout Dorado (the Beagle) equipped with a 150 hp Yamaha we have the ability to cover a lot of water quickly and still get onto the small islands that provide for unique perspectives of the area.

Our knowledge of the local area is good, and getting better, but we still rely on charts to keep off the rocks and help us find our way. If you have ever boated in the 30,000 Islands you will know how similar, yet unfamiliar, the many islands and inlets can seem. Having good charts is absolutely critical unless you have been on Georgian Bay for years or limit yourself to a few routes.

Until last summer we had been working with the approved commercially available Small-Craft Nautical Charts covering the area from south of the Massasauga Park to north of Pointe au Baril. They were effective but often proved difficult to use in practice. As an open cabin boat the charts would flutter when opened at cruising speed, they constantly needed to be ‘flipped’ over, and with time they were getting worn. But perhaps the biggest problem was that they did not tell you where you were. If you went exploring you needed to keep a sharp eye on where you had come from and where you thought you were. What seems easy in the introductory Power Squadron courses becomes a challenge at 40-50 kph, especially when the area is unmarked and there is the real prospect of hitting a rock.

So with that background you can understand why we started to investigate electronic charts. There are a few ways to go when it comes to electronics. One option is a dedicated GPS and plotter combination, much like the GPS units that come factory installed in cars and trucks. A second option is a handheld device like an iPhone, an Android phone, or a mobile GPS unit. These devices come with a GPS function built-in that can be used to plot your trip. When used in an automobile they connect with cellular towers to access maps that not only tell you where you are and display the roads, but also tell you how to get there. This is also an option when boating, but its really not practical, the screen is too small for boating at any type of speed, although it might be practical if canoeing, kayaking or sailing. And the ‘free’ mapping options don’t provide marine charts with water depths and navigation markers.

The third choice, and the one we will discuss in these articles, is using charting software on an Apple iPad. While the charting applications (Apps) we will review can be used on all iPads it’s only the GPS equipped iPads (not the less expensive WiFi-only models) that permit real-time location capabilities. These iPads typically cost about $100 more than the comparable WiFi-only models.

In our case we have a 3rd-Generation 32 GB iPad that is used for navigation, as well as credit card processing and the usual business email type activities, it also provides us with a real-time shore connection (texting and social media). It’s a very portable multifunction device that provides us with remarkable flexibility. The larger screen makes it much easier to see both details and the ‘big picture’.

But it would not be very useful on the Beagle without it’s GPS and charting capabilities. A fixed GPS and plotter would not only be considerably more expensive and require professional installation, it would take up precious space and not provide as much functionality.

In terms of charting Apps we used one package last summer with rather indifferent performance. It was, as a former colleague of mine would say, “better than a poke in the eye with a sharp stick”. But it was far from optimal. Over the winter we looked into a couple of other options, one of which has become our go-to charting App. But your needs may be different. We’ll review our experience with the three Apps in the following series of post that I’ll try to get out on a weekly basis.

J. Bossart

Next Post (2) – Introducing the Three Apps

Disclaimer: all comments and opinions are the solely mine and not those of the Parry Sound Power and Sail Squadron. If you find an error or want to provide your perspective please post a comment. I’ll review them for appropriateness (there are too many spam bots out there) and make sure it gets posted up as soon as possible.

Flags Over Sail Parry Sound

Flags Over Sail Parry Sound

Christmas in July – Enthusiastic Response

ParrySights-8635

There was  good turnout for the Squadron’s Christmas in July ‘sail/boat-by’ just prior to  fireworks in the Parry Sound Harbour. The participants showed enthusiasm and creativity in their use of lights.

In the picture above you can see the procession ‘coming and going’ in front of the town dock. If you click on the image you can see a larger version that makes it easier to identify individual boats. (If you would like a copy of the image drop me an email – communications@parrysoundsquadron.ca).