Equipment/Software

Using Google Earth for Local Navigation

If you boat among the 30,000 Islands of Georgian Bay you are well aware of the many hidden rocks and shoals that seem to wait, daring you to come their way. A couple of days ago I saw a 40-foot power boat onshore with its bow ripped apart following an unadvised shortcut between channels. That’s life exploring the Georgian Bay Biosphere. Stay in the small craft route and you are guaranteed to have no surprises. Wander off the ‘beaten track’ into the more interesting areas and you take responsibility for what happens.

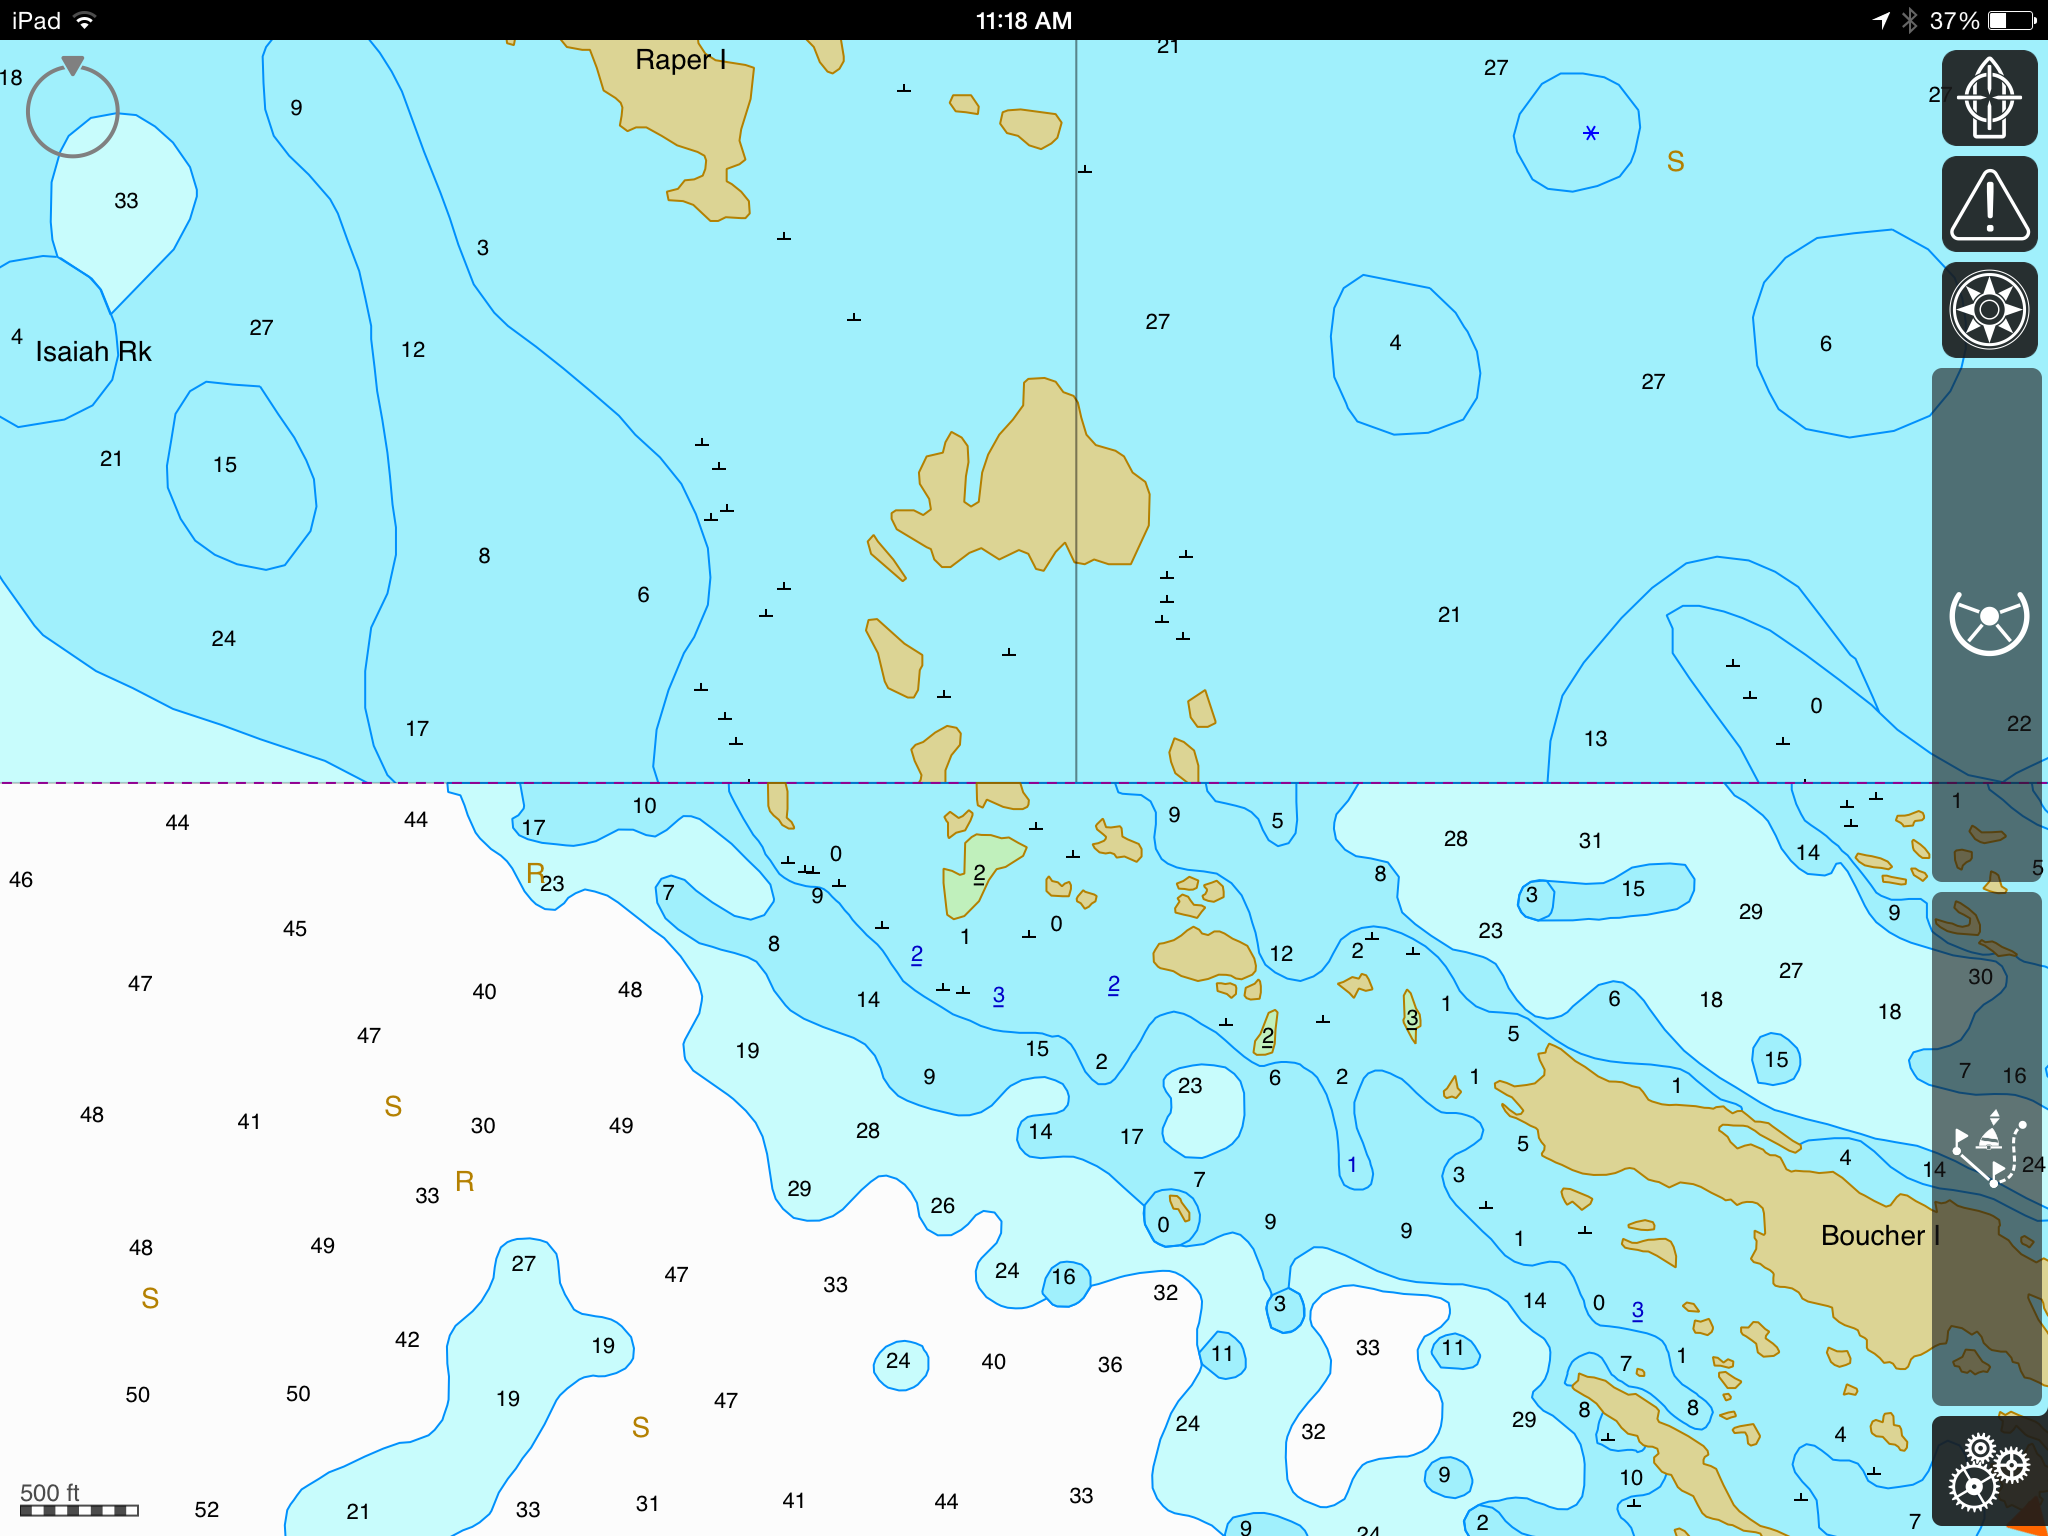
In a series of reviews last year I looked at how iPad apps from Navionics, iSailor and iNavX made it much easier to head off the small craft routes and explore some of the thirty thousand islands. Well these apps are great but they are not perfect as I found out last weekend on a trip from Parry Sound to Little McCoy Island (45.458303, -80.481705). This was a new destination for us and I spoke with couple of people about the best route to take as well as consulting with the Navionics and iSailor apps on my iPad. On route I was careful to ensure I stayed on my planned route using the Navionics app. Here’s a snapshot of the path once beyond the charted small craft route. The darker blue represents a depth of less than 6 feet while white represents depths of more than 6 feet. Boating with our 21-foot Scout and 150-hp Yamaha outboard I’m pretty comfortable with depths of 4-feet or more, and right now we are dealing with water levels at or slightly above chart datum.

LittleMcCoy_v1Heading west of Franklin Island towards Little McCoy.

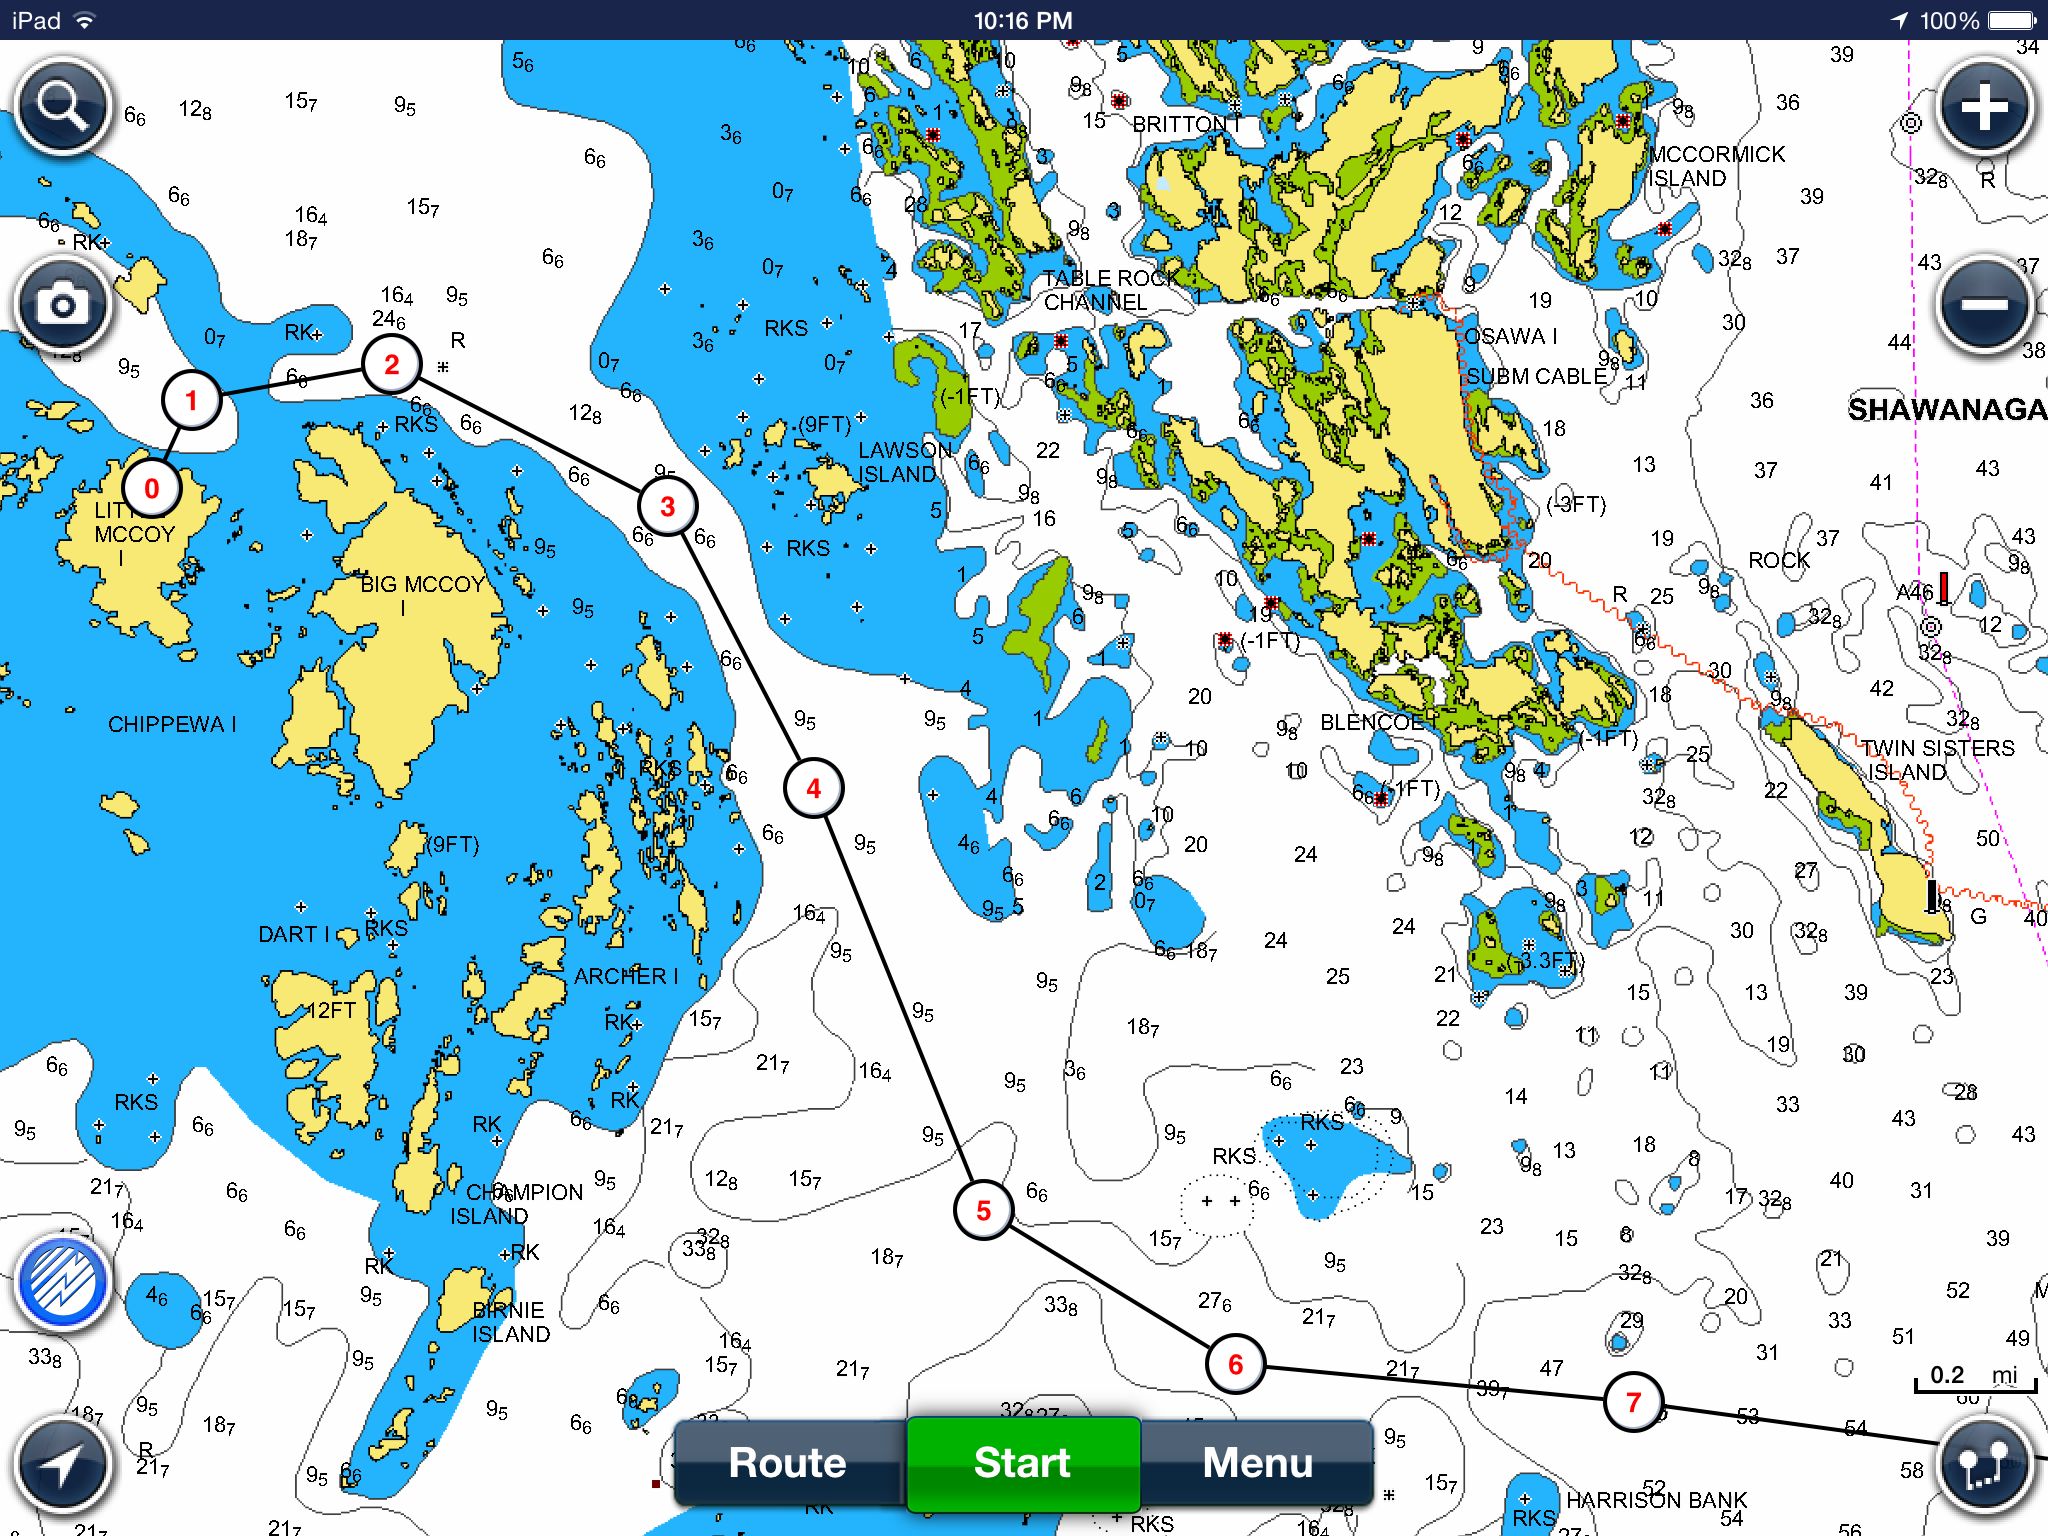
Here’s a closer look as you approach the McCoy’s. It’s pretty obvious that there is a safe seam running east of the McCoy Islands with issues just as you approach Little McCoy Island. Or so you would think.

LittleMcCoy_v2

On the way in I managed to ding the prop, not too seriously, about where you see the Number 2 on the Navionics chart. (Click image for a larger view.) On the way back I suffered a separate ding, at higher speed, between points 3 and 4. According to the charts I was in an area that should have had more than 6-feet of water. In particular the ding beyond point 3 (heading south) was a surprise, as evidenced by the fact that I was confidently moving at about 40 kph (25 mph) – ouch, ouch, ouch. There had been no problem on the way in and I was pretty much on the same track. (That’s another nice feature of Navionics and iSailor, you are able to lay down a track that you can follow when returning.)

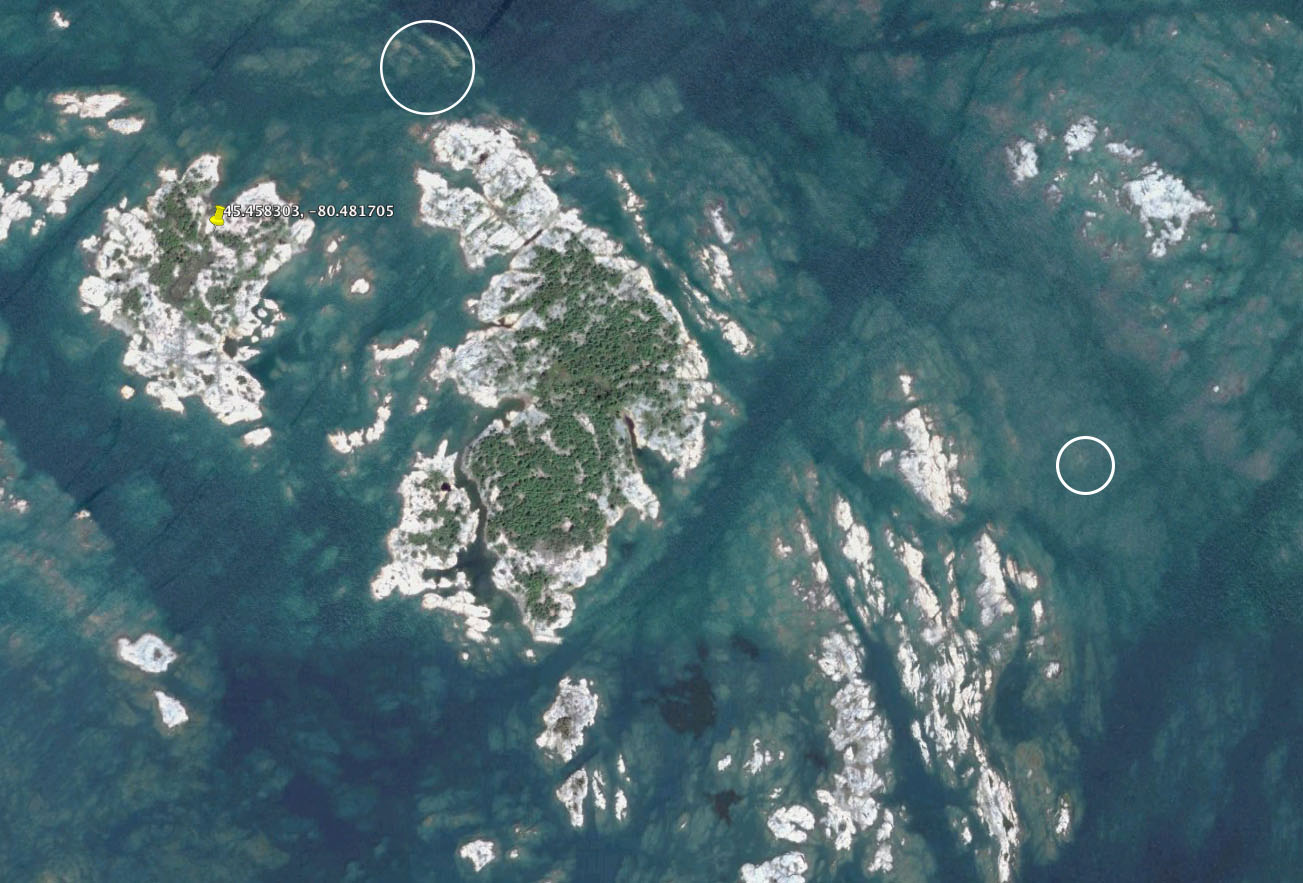
Now about Google Earth. In this part of the world Google Earth and Google maps have on and off coverage, here’s an example of the area around Franklin Island and the McCoys. In those areas where there is a stretch of open water they generally choose to blur out the area with a not very aqua blue. (Hey it’s just water what else is there to show?)

Google_Earth_Franklin-McCoys

Looking closer (below), Google Earth can explain what I ‘discovered’ on my way in and out of Little McCoy. It’s pretty obvious that there is a seam in the channel that is consistent with the Navionics charts. But they are not perfect seams as you can see looking a little closer. I’ve tried to approximate the ‘ding points’ on the Google Earth projection and you can see what I discovered with the bottom of my outboard. What Navionics didn’t catch were the several shallow points in the area identified as 6-feet or deeper. No criticism of the app, they can’t be expected to have information on every square foot of Georgian Bay.

Google_Earth_McCoys_Ding_Points

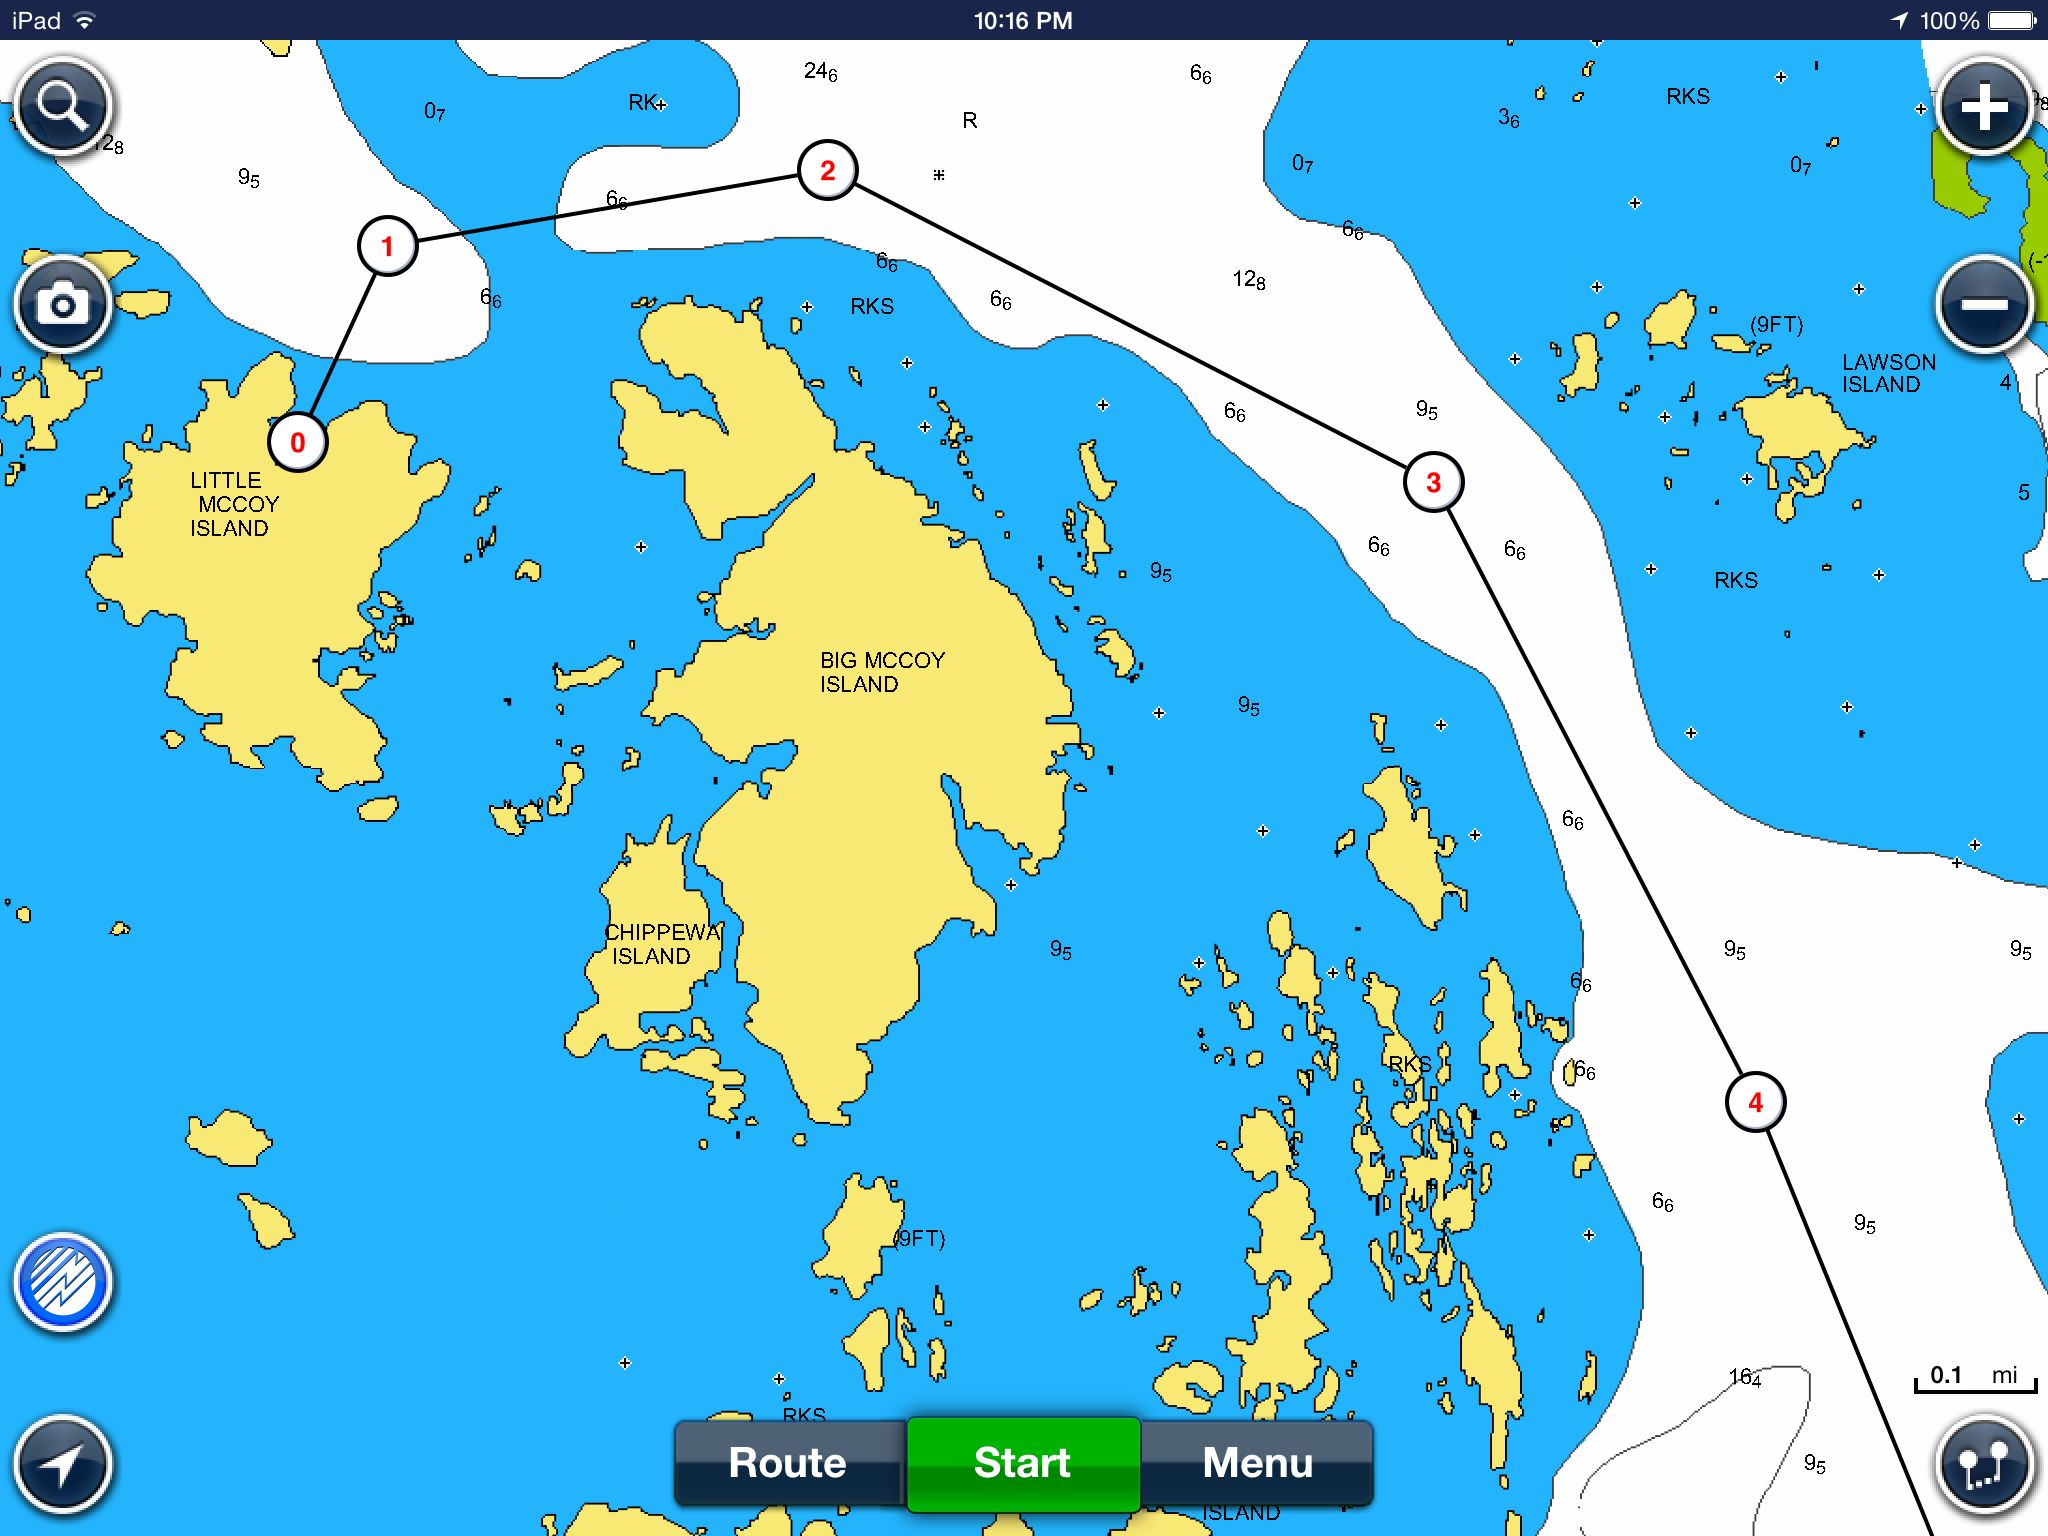
What is interesting is the area north of Big McCoy Island (below). Contrary to what is indicated by Navionics it seems the safer route is closer, not further away, from the island.

Google_Earth_McCoys_North

Lesson learned and a look at Google Earth will be part of my standard operating procedure when wandering too far off the well charted areas. Actually I will  pay better attention to the Google Earth information and plot some of the more challenging points on the Navionics charts. The irony is that I did look at the Google Earth maps before heading out but failed to look close enough and map it against the Navionics chart data.

Google Earth and Navionics seem to be a natural fit and worth exploring before heading out. Whatever type of ding the prop and skeg took it didn’t impact performance on the way back, but I haven’t yet had the courage to tilt the engine forward and take a look.

JB – Communications Officer


iPad Navigation Apps – Informal Reviews Spring Update

Last fall I provided a series of informal reviews on navigation apps that could be used with a GPS equipped Apple iPad. That would be the Wi-Fi/Cellular version, which is priced at a $130 premium to the WiFi only model in Canada. In theory these apps should also work with the the WiFi/Cellular version of the iPad Mini and the iPhone. After using these apps last summer I suspect the screen size of the iPhone and possibly the Mini  is a little too small to be practical if you are traveling more than 20 kph, at least in our waters where there seems to be a rock every few hundred meters. In theory, if not in practice, these apps are also available for Android tablets and phones. The basic Nexus 7″ tablet, available for about $250, has the advantage that it has GPS built-in, and represents a significant savings over an iPad with GPS functionality. The “in practice” comment earlier relates to the fact that not all of these apps are yet available in an Android version.

All of the apps reviewed last fall have received updates over the winter. This review covers the changes in a general sense and updates my opinion of their value for my uses. A reminder, I operate a 21-foot Scout Dorado with a 150 hp Yamaha in and around Georgian Bay. There are a claimed 30,000 islands, and an estimated 100,000 shoals. We typically motor at about 40 kph to optimize travel time and fuel economy. Even at 40 kph things move by pretty quickly.

Becuase we still have ice on the Big Sound I have only been able to ‘desk test’ the upgrades. Desk use of the apps is really quite important. I spend hours looking over the charts and planning new routes and destinations. Google, Apple and Bing maps are well short of adequate when looking beyond where roads run, and available nautical charts are generally not detailed enough once you go off the charted courses. Paper charts also don’t zoom or scroll very well, although they do rotate very nicely.

The bottom line in my opinion (details follow).

#1 – Navionics for iPad (~$55.00, US & Canada)
#2 – iSailor for iPad (~$15.00, Lakes Superior, Huron Ontario, ..)
#3 – iNavX for iPad (~$120, app plus Georgian Bay only

#1 – Navionics

This app has made some changes in their app, but nothing that really makes a difference in my life. Although it’s not the cheapest it represents the best value in my opinion with vector graphic mapping and very good accuracy in terms of markers. I was also encouraged speaking to an individual at the Toronto Boat Show in January who said Navionics is actively doing depth measurements in Georgian Bay to fill in areas with limited existing information. Those are exactly the areas that I spend my time, off the beaten track. This is a good application that is easy to use on the boat and when sitting at the desk. The standard chart package covers all of the USA and Canada, much more than I need, but I’ve actually had fun using it while on a 3-hour dinner cruise out of Philadelphia on the Delaware River.

#2 – iSailor

They recently announced a major overhaul of their interface. I guess it’s actually different, and presumably improved, but it really hasn’t registered with me. I have a couple of beefs with this app. The first is that it is missing markers in an area I regularly boat, the area outside of Regatta Bay in particular. I’ve spoken with them in the past and they added in the markers outside of Snug Harbour but are still missing Regatta Bay. If these markers are missing what else do I need to be worried about? The second issue concerns the mapping when I’m sitting at my desk and ‘snooping’ around for new destinations and routes. It seems the variously scaled charts maps don’t overlap properly and it just looks strange. This gets to be a real problem with the Mink Islands where actual islands are missing if you have the view at the wrong scale. It’s not an issue of the scale being too wide, it’s just a glitch in the system. But this app is the least expensive and if the markers are correct in your part of the world it represents a bargain.

Looking at the app again as I sit here writing this post I’m finding the app to be quite buggy, not only is there a misalignment of the charts, the markers come and go as I pinch to zoom in the various areas. The markers are visible when zoomed out but not zoomed in. I see that the markers for Regatta Bay are now shown, but only if you are zoomed out sufficiently. Zoom in and they are gone. Regarding the chart misalignment, here a screenshot showing the problem (click on the image to see a larger version).

iSailor_Screenshot_2014-04-19

#3 – iNavX

This was my first app for the iPad. It matched up with the strip charts. That’s a virtue and a real liability. The benefit is familiarity but your are limited to the strip charts. If you want to head a couple of kilometers off the charted routes you are on your own. The charts are not vector based, so there is a real limitation on zooming in on the details that don’t exist with the other two apps. Price is also an issue, for two reasons. The first is the $120 ‘start up’ cost to get just the Georgian Bay charts. It’s probably cheaper than the paper charts, but I still need to carry the paper charts if I’m boating commerically. And then there was the mid-winter upgrade. You know how it works, you get a message that an app has been updated, click here to update. Well I did just that with the iNavX app, which uses the Fugawi X-Traverse charts. When I then opened up the app all of my charts were gone. Gone! Not only was the app updated but my original charts were removed. I realize that I am not eligible for updated charts (things don’t change much in these parts), but delete the charts that cost me $60? My paper charts don’t disappear when there are updates. I contacted the company and was told I could get the updated charts for $10. Well that’s not too bad, but I still haven’t done it yet. I probably will pay the $10 to have them and salvage something from my original $120 purchase, but I’m still ticked off. Please, let me know that I’ll lose all of my charts if I choose a ‘free’ update. I was perfectly happy with the previous version of the app.

So there you have it, a users opinion of three navigation apps for the GPS equipped iPad. I may decide to try the Navionics app on my Google 7″ Nexus tablet (2013 version) but that promises to set me back $55 plus tax. It’s hard to rationalize when I have a paid-for 3rd Generation GPS equipped iPad sitting in an Otter Box. The Nexus is very useful when traveling in the car and you use it to complement a Garmin GPS system. That involves about a $2 investment in downloading road maps to the Nexus that can be used offline.

Charting Apps – An Informal Review, iSailor (5)

The last post covered the Navionics USA & Canada HD app from Navionics. In this post I will provide a concise review and opinion on the iSailor app for the iPad as applied to the Georgian Bay area. I am using this app with a 3rd Generation (Wifi+Cellular) iPad. To allow for a better comparison with the iNavX and Navionics apps I discussed in the last two posts I have included a short video demonstration of how the app looks and operates.

iSailor
Publisher: Transas Marine International (www.isailor.us)
Price: Free for app, $4.99 for Lake Huron & Lake Superior charts (together). In looking at other charts I’m finding that the prices for the other Great Lakes areas, i.e., Canadian Lakes Ontario and Erie as a package, and all the Canadian Great Lakes, are on the order of $24.99 to $39.99, more on the order of Navionics. The USA charts though are much less.

I really want to like this app. It has a very nice interface and uses vector graphics. It’s reasonably fast and how can you beat the price. But the charts for the Georgian Bay area are missing some critical market buoys that are on the small chart route. These buoys are in areas that we regularly boat and their absence is obvious. I worry then that there will be missing buoys in areas which I’m not familiar with which means I’ll need to double check with another app or paper charts. Not good. There is also a strange rendering issue where two adjacent parts of the displayed chart don’t match. I’m not sure what this is and suspect it’s probably only an issue when I’m working at my desk and scouting out a trip. I really like it, but ….

The video below provides a ‘slice of life’ regarding this app. The video covers many of the same topics that were discussed in the videos of the other two apps and highlights the pros and the cons of the Navionics app.

Pros:
1. Smooth vector graphics make the chart easy to see and understand at my desk and on the boat. The response time is very good in terms of pinching to zoom and scrolling. (Note: we are required to carry, and do carry, paper charts with us.)
2. It does a very good job of identifying the boat’s location and recording a traveled track.
3. It allows for the simple plotting of a course.
4. Permits the setting of markers for depth areas.
5. The separate charts are priced on the order of $5.00 each which is a real bargain considering the app is ‘free’. I could easily purchase the necessary charts for the Great Lakes for $25.00 or less, but I really only need the Lake Huron charts which includes Lake Superior and cost $4.99 (plus tax). This pricing makes it a ‘no brainer’ to buy updated charts annually. (Note: I’m not sure if prices have gone up but it seems other Canadian Great Lakes charts are on the order of $25 to $40, perhaps not so much of a no-brainer.)
6. The iSailor app takes about 57.6 MB of space on the iPad versus 180 MB for iNavX and  115 MB for Navionics. Note that our iNavX installation only covers Georgian Bay, and our iSailor installation Lakes Huron and Superior, while Navionics covers all of the USA and Canada.

Cons:
1. There are missing buoys in our area (Snug Harbour / Franklin Island).
2. The chart display misalignment is very annoying.
3. There is little else to knock them for but of course we really don’t use all of the features of the app. There may be issues specific to the east and west coasts (tides, etc.) that aren’t apparent to us.

Here’s a video that shows the iSailor  app in action (in the office).  I’m not equipped to do an on-board demo. It performs similarly when used on the boat. There is an HD icon in the top right area of the video, click on it to see a better resolution version.

Note: electronic charts are not a substitute for up-to-date paper charts. You should carry paper charts in addition to electronic charts. Stuff happens and devices can fail when you need them most. Always have a backup.

Links:
Post #1 (Introduction)
Post #2 (Overview)
Post #3 (iNavX Review)
Post #4 (Navionics Review)

Charting Apps – An Informal Review, Navionics (4)

Update: Since the original post I received a message from Navionics to upgrade the charts for $54.99, essentially I am buying the app annually to get access to the updated charts. This seems to be a bit unreasonable to me. Yes I get all of the charts for Canada and the USA, but I really only need and want the charts for Georgian Bay. They are forcing me to pay for more than I need. I’m not crazy about this. Perhaps $9.99 for the updated Great Lakes charts would be reasonable. I’ll just stick with the 2012 version. It makes the iSailor app look like a real winner in comparison.

The last post covered the iNavX app from GPSNavX and the Georgian Bay charts from Fugawi X-Traverse. In this post I will provide a concise review and opinion on the Navionics app for the iPad as applied to the Georgian Bay area. I am using this app with a 3rd Generation (Wifi+Cellular) iPad. To allow for a better comparison with the iNavX app discussed in the last post, and the iSailor app that will be presented in the next post, I have included a short video demonstration of how the app looks and operates.

Navionics, USA & Canada HD Details
Publisher: Navionics (www.navionics.net)
Price: $54.99 for app including the charts for the USA and Canada. Annual updates are also $54.99.

This has become our ‘go-to’ charting app when heading out on the Big Sound outside of Parry Sound, Ontario. It just works and the interface is pretty simple to figure out. Because I don’t use it every day, I’m not out everyday and there are times I’m boating in areas I am very familiar with, I sometimes need to poke a couple of the icons to remind myself with what is what. It’s really excellent when used at my desk to plot a course and to figure out where to go with clients. I can pinch to zoom and scroll everywhere in Georgian Bay without needing to load another chart.

The video below provides a ‘slice of life’ regarding this app. The video covers many of the same topics that were discussed in the previous iNavx video and highlights the pros and the cons of the Navionics app.

Pros:
1. Smooth vector graphics make the chart easy to see and understand at my desk and on the boat. The response time is very good in terms of pinching to zoom and scrolling. (Note: we are required to carry, and do carry, paper charts with us.)
2. It does a very good job of identifying the boat’s location and recording a traveled track.
3. It allows for the simple plotting of a course as you can see in the video.
4. Permits the setting of markers for depth areas. In our case we highlight in darker blue the areas that are 6 feet or less.
5. All charts for North America are included in the base price. This offers a real savings for the boater who likes to cruise longer distances when compared with the ‘area by area’ map charge with iNavX. The pricing is very reasonable for what you get, even if you only use a subset of the provide charts. iSailor similar to iNavX offers a la carte pricing for North American charts.
6. The Navionics app takes about 115 MB of space on the iPad versus 180 MB for iNavX and 57.6 MB for iSailor. Note that our iNavX installation only covers Georgian Bay, and our iSailor installation Lakes Huron and Superior, while Navionics covers all of the USA and Canada.

Cons:
I’m really at a loss to point out any cons. It just works. Sure it could be cheaper, but it still is a relative bargain in terms of what it does and its utility. We don’t need to deal with tides in Georgian Bay so perhaps it could be better in that regard, but perhaps it’s already pretty good, I just haven’t assessed it for this.

Here’s a video that shows the Navionics app in action (in the office).  I’m not equipped to do an on-board demo. It performs similarly when used on the boat. There is an HD icon in the top right area of the video, click on it to see a better resolution version.

Note: electronic charts are not a substitute for up-to-date paper charts. You should carry paper charts in addition to electronic charts. Stuff happens and devices can fail when you need them most. Always have a backup.

Links:
Post #1 (Introduction)
Post #2 (Overview)
Post #3 (iNavX Review)

Charting Apps – An Informal Review, iNavX (3)

In the last post I provided a short overview of the three apps that I have purchased and used on my iPad (3rd Generation/Wifi+Cellular) for navigating in and around Georgian Bay. In this post I will provide a little more detail about the iNavX app including a short video demonstration of how the app looks and operates.

iNavX Details
Publisher: GPSNavX (www.inavx.net)
Price: $49.99 for app, $70.00 for electronic charts (Tobermory to Little current). The subscription allows for one year of chart downloads to as many as two separate devices, thereafter updates are $70.00.

I worked with this app for most of last year before discovering the two other apps that are included in this Informal Review. It should be realized that the effective cost to use the iNavX app on the iPad is about $120 plus taxes. The basic app provides no charts as part of the purchase price. The charts are purchased separately from Fugawi X-Traverse (www.x-traverse.com).

The video below provides a ‘slice of life’ regarding this app. In general this is not a navigation app that I use despite the relatively high price I paid for it. This of course is a personal opinion and I’ll share my thoughts on what is good and not so good about the iNavX app.

Pros:
1. Charts basically replicate the paper charts. (Note: we are required to carry, and do carry, paper charts with us.)
2. It does a very good job of identifying the boat’s location and recording a traveled track.
3. It allows for the plotting of a course, but this is not very practical as one needs to determine what chart to load next when plotting a course when in port or at home.

Cons:
1. The raster graphics are pretty rough to look at. The charts are basically an image of the paper charts. As you zoom in everything gets larger, it’s much like looking at the paper charts with a magnifying glass.
2. The charts are all in separate files/folders, there are about 90 individual charts for Georgian Bay. The labels used for the different charts in some way relate to the labels used with the paper charts, but not exactly, and not intuitively. This can make it tough to figure out what chart you need to look at to see the continuation. For example the edge of one chart may indicate that the continuation is on Chart 2242, but it isn’t included in the package. In other cases the chart may indicate a chart number but it is not the same number as used by the X-Traverse charts.
3. Not all the interesting areas of Georgian Bay are covered by the charts that are provided. For the most part the charts seem to cover the small boat routes. If you want to head out further there are no charts. And further out isn’t that far, for example I can’t easily find a chart that shows the Umbrella Islands, or the Snakes or the Limestone Islands. In most cases the provided charts with iNavX and X-Traverse just show the small boat routes and not all of the islands. You could not use this app to travel directly west across Georgian Bay from Parry Sound to the Bruce Peninsula.
4. The charts don’t scroll as you look at them when you are at home, or in port. To plot out a route or just check on where you might want to go you need to figure out what chart you need and then load it, and then the continuation chart. It really is not very easy. This is a very big issue with me as there are some 90 charts to select from. Once you are traveling and iNavX is plotting your location it will automatically scroll from chart to chart, so this is good news.
5. There doesn’t seem to be any way to set custom depths. In our case we like to have the six foot and less areas highlighted. Others might like the limit set to 8 or 12 feet. The iNavX charts do offer the standard paper chart colouring for shallow areas.
6. At $120 they are the most expensive by far.

Here’s a video that shows the iNavX charts in action (in the office).  I’m not equipped to do an on-board demo.

Note: electronic charts are not a substitute for up-to-date paper charts. You should carry paper charts in addition to electronic charts. Stuff happens and devices can fail when you need them most. Always have a backup.

Links: Post #1 , Post #2